True face of Lib Dems
I have always been and will continue to be totally committed to the aims of Richmond United Group (RUG) and its belief in proper democracy and accountability for local politicians. However this is what the Lib Dems say, no apology has ever been issued to RUG for this outrage and no statement has been made about the Lib Dems intention to ever follow local residents' views in future. This is in fact what they are really like…

The Will of the People
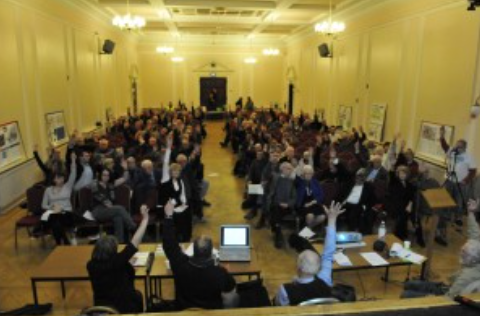
Richmond United Group voting to Save Twickenham Riverside in the face of the Lib Dem “luxury housing scheme”

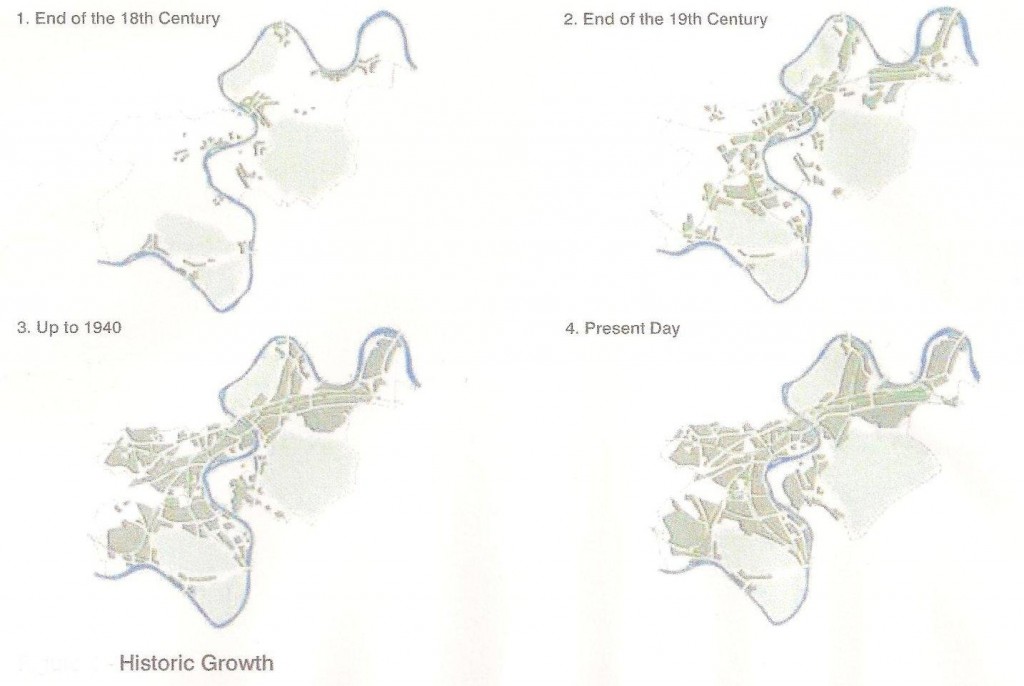
Growth in Twickenham & Richmond
This map is the present day urban footprint, the areas in grey are the only space left and represent our parks and open spaces. If the Lib Dems, Tories and Labour want to build 42,000 houses by 2050, where can this take place without destroying all the open space?

The Office for National Statistics 2006 – Based on Population Projections for LBRuT
| Authority | Projected Population | 2006-2011 | 2006-2031 | |||
| 2006 | 2011 | 2031 | Average Increase per year | AverageAnnual Growth Rate | Average Increase per Year | |
| 000s | 000s | 000s | 000s | % | 000s | |
| England | 50,763.0 | 52,706.5 | 60,431.6 | 388.7 | 0.75 | 386.7 |
| London Boroughs | 7,512.4 | 7,811.1 | 8,831.7 | 59.7 | 0.78 | 52.8 |
| Inner London | 2,721.8 | 2,888.6 | 3,358.9 | 33.4 | 1.20 | 25.5 |
| Outer London | 4,790.8 | 4,922.5 | 5,472.7 | 26.3 | 0.54 | 27.3 |
| City of London | 7.8 | 8.2 | 9.7 | 0.1 | 1.01 | 0.1 |
| Kensington & Chelsea | 178.0 | 195.4 | 240.8 | 3.5 | 1.88 | 2.5 |
| Southwark | 269.2 | 287.9 | 335.2 | 3.7 | 1.35 | 2.6 |
| Tower Hamlets | 212.8 | 231.4 | 278.4 | 3.7 | 1.69 | 2.6 |
| Wandsworth | 279.0 | 295.0 | 338.3 | 3.2 | 1.12 | 2.4 |
| Westminster | 231.9 | 260.5 | 324.9 | 5.7 | 2.35 | 3.7 |
| Kingston upon Thames | 155.9 | 166.2 | 199.2 | 2.1 | 1.29 | 1.7 |
| Richmond upon Thames | 179.5 | 188.6 | 218.3 | 1.8 | 0.99 | 1.6 |
| Sutton | 184.4 | 191.4 | 221.7 | 1.4 | 0.75 | 1.5 |
| Waltham Forest | 221.7 | 223.9 | 223.2 | 0.4 | 0.20 | 0.7 |
Using these figures this would give a total population figure for 2011 of 188,600 and a growth rate of 0.99% which means the population would double and all associated services housing and land building would therefore in real terms need to double every 70 years.